
Loading Experience
Linked Patient Learning
Loading Experience
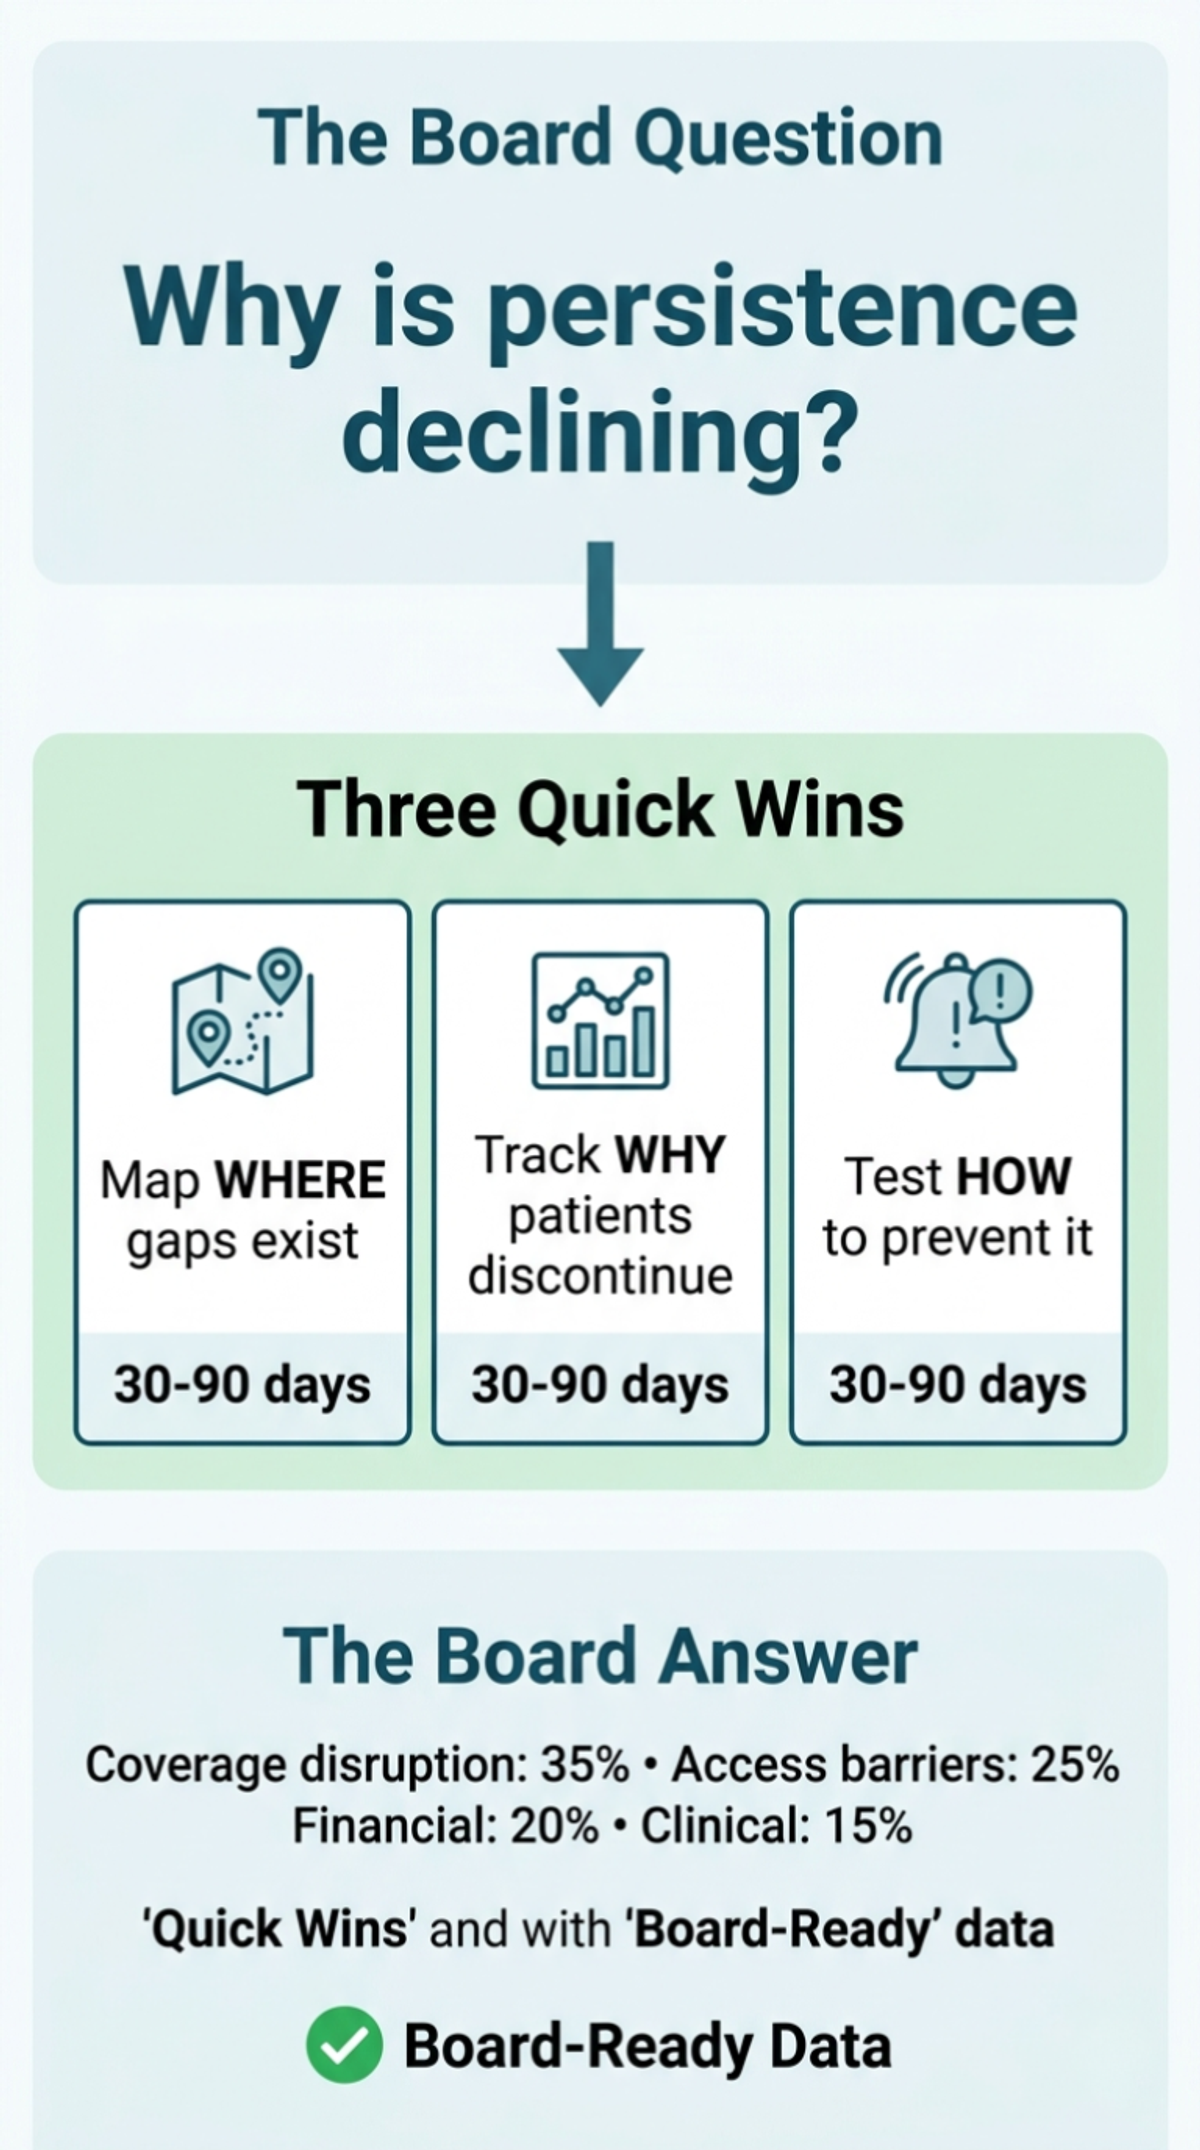
Your next quarterly board meeting is coming.
Last quarter, they asked why persistence is declining. You said "patient non-adherence." They asked what you're doing about it. You gave the standard answer—enhanced education, more touchpoints, better hub training.
They weren't satisfied.
Next quarter, you need better data. Not new vendors. Not 18-month infrastructure projects. Data you can get starting this week.
Here are three quick wins that prove the business case for 90% infrastructure—and give you real answers for your board.
Quick Win #1: Map ONE High-Risk Patient Journey
What it is: Take your most complex patient journey—rare disease, high-cost specialty therapy, or product with worst persistence rates—and trace what actually happens from enrollment through Month 12.
How to do it (2-3 hours):
What you'll discover:
You'll see gaps you didn't know existed. Example patterns that emerge:
Why it matters:
This 2-hour exercise reveals your highest-impact infrastructure gaps. You now know WHERE to build, not just that you should build.
For your next board meeting: Show the journey map. Say: "We identified three handoff failures causing 60% of discontinuations. Here's our plan to close them."
Immediate action: Share timeline with patient services VP. Ask: "Which of these gaps could we close this quarter?"
Quick Win #2: Add Root Cause to Your Discontinuation Tracking
What it is: Stop accepting "patient discontinued" as the answer. Start categorizing WHY.
How to do it (ongoing, 10 min per discontinuation):
Create simple taxonomy:
When patient discontinues, have hub make ONE additional call attempt specifically to understand why. Document in your system.
Track for 90 days.
What you'll discover:
Your Q1 board presentation said "patient non-adherence increased 15%."
Your Q2 board presentation can say: "Discontinuation increased 15%—35% due to coverage disruption (up from 20% last year), 25% access barriers, 20% financial, 15% clinical, 5% unknown."
Why it matters:
You can now answer the board's next question: "What are we doing about it?"
You've turned "unexplained problem" into "actionable strategy."
For your next board meeting: Show root cause data. Say: "Coverage disruption is our biggest driver. We're building early detection systems to intervene before gaps cause discontinuation."
Immediate action: Update hub discontinuation protocol this week. Review first 30 days of data.
Quick Win #3: Create Coverage Gap Early Warning for Your Top 100 Patients
What it is: Identify your 100 highest-value patients (longest on therapy, most clinically stable, highest LTV). Build simple system to detect their coverage changes before they become gaps.
How to do it (1 week setup):
What you'll discover:
At least 10-15 of your top 100 will have coverage events in next 90 days. You'll intervene proactively instead of reactively.
For those 10-15 patients, you'll see whether early intervention prevents discontinuation.
Why it matters:
You're testing the core 90/10 hypothesis: early detection + proactive intervention = better persistence.
For your next board meeting: Show pilot results. Say: "We tested proactive coverage monitoring on 100 high-value patients. Early intervention kept X patients on therapy who would have otherwise discontinued. Here's the business case to scale."
Immediate action: Identify top 100 patients this week. Build coverage calendar next week. Start outreach immediately.
Why These Quick Wins Work
Each one:
The progression:
And all three give you board-ready answers for next quarter.
What Happens After Quick Wins: The Scale Problem
These quick wins prove the 90/10 hypothesis works. But they also reveal why manual approaches don't scale.
Journey mapping for one product took 3 hours. Your portfolio has 12 products. Manual mapping isn't sustainable—and this is just FINDING the gaps, not fixing them.
Coverage tracking for 100 patients required 2 weeks to build manual calendars and reminders. Now scale that to 2,000 patients across multiple insurance types, states, and changing Medicaid redetermination schedules. You need automated systems, not spreadsheets.
The pattern: Early detection prevents discontinuation. Proactive intervention works. But manual execution doesn't scale.
Most companies hit this wall 90 days after starting quick wins. They've proven the value. They can't scale it without infrastructure.
That's the difference between proof of concept and competitive advantage.
Linked Patient Learning helps biopharma teams move from quick wins to comprehensive 90% infrastructure—building the ecosystem visibility, early warning systems, and intervention protocols that maintain therapeutic continuity at scale.
Two pathways:
Quarterly board meeting coming? We'll help you execute the three quick wins, analyze results, and prepare board-ready presentation showing root cause data and infrastructure roadmap.
Already proven the concept? Schedule a 90/10 Infrastructure Assessment to design the automated systems that scale across your patient population—cross-vendor integration, real-time early warning, systematic root cause tracking, and proactive intervention protocols.
Written by
Linked Patient Learning
Share your details and we'll send you the playbook.