
Loading Experience
Linked Patient Learning
Loading Experience
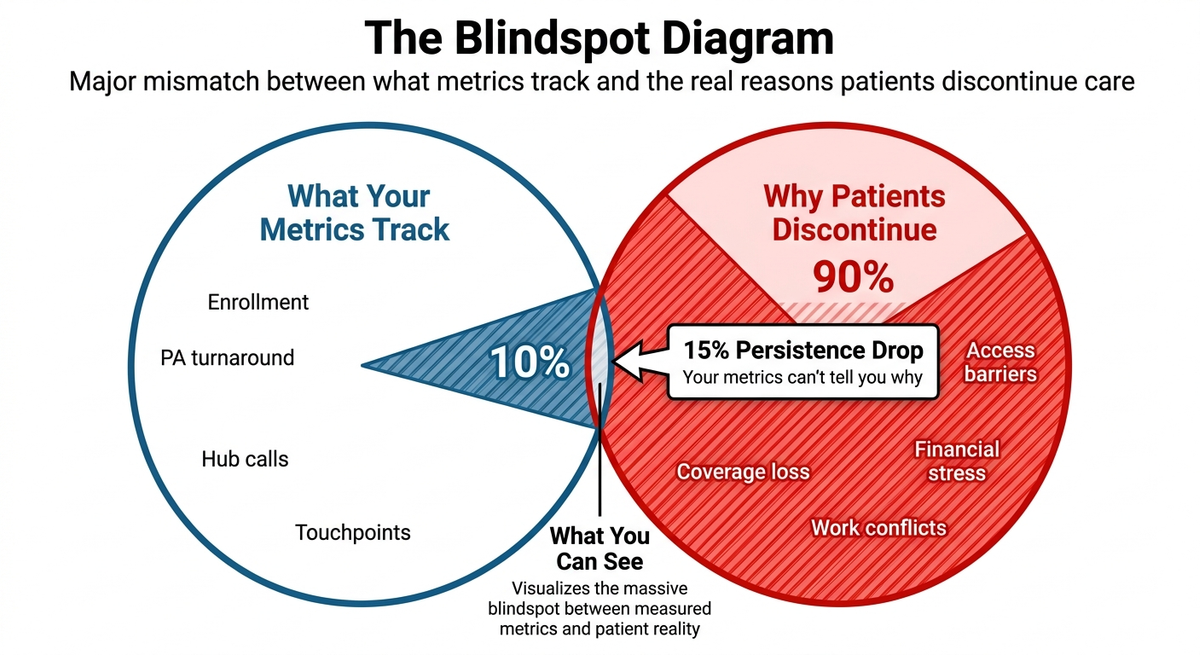
Consider your dashboard: 92% enrollment completion, 48-hour PA turnaround, excellent call resolution.
But persistence is dropping 15% year-over-year.
Your metrics can't tell you why.
Coverage churn from the One Big Beautiful Bill Act won't show up in your patient support reports as "coverage disruption." It'll show up as problems you think you understand—but don't.
The Board Meeting Problem
Your Q4 board presentation: Persistence down 15% year-over-year.
Board: "Why?"
You: "Patient non-adherence increased."
Board: "What are we doing about it?"
You: "Enhanced education programs, more frequent touchpoints, improved hub training."
Board: [Unconvinced silence]
What you couldn't say: "We don't actually know why. Our metrics don't tell us if it's coverage loss, access barriers, or clinical decisions. We're flying blind."
What Coverage Churn Looks Like in Your Data
With Medicaid six-month redeterminations replacing annual reviews and work requirements taking effect by December 2026, millions of patients will experience repeated coverage disruptions. American Medical AssociationHealthInsurance.org
Here's how that appears in your metrics:
Your system shows: "Patient non-adherence - missed refill"
Reality: Medicaid redetermination in process, coverage lapsed, patient can't afford out-of-pocket
Your system shows: "Patient unreachable - 3 failed contact attempts"
Reality: Patient working extra hours to meet work requirements, can't take calls during hub business hours
Your system shows: "PA denied - patient did not complete required documentation"
Reality: Patient lost coverage mid-treatment, new coverage requires different PA process, patient gave up
Your system shows: "Patient discontinued therapy - personal choice"
Reality: Rural hospital closed, nearest infusion center now 90 miles away, patient couldn't maintain schedule
Your metrics aren't wrong. They're just measuring the 10% (what happened in your systems) while missing the 90% (why it happened in patients' lives).
The Metrics You're Tracking (The 10%)
Patient support dashboards typically measure operational excellence:
These metrics tell you your vendors are performing well. They don't tell you whether patients are staying on therapy—or why they're not.
What You Should Measure Instead: 3 Core Metrics
With an estimated 10 million people losing coverage by 2034, coverage continuity becomes the determining factor for therapeutic persistence. American Medical Association
Stop tracking 15 operational metrics. Start tracking these three:
1. Coverage Gap Detection Time
2. Discontinuation Root Cause Attribution
3. Coverage Disruption Rate
These three numbers tell you what's actually happening to patients. Everything else is vendor performance metrics.
The Question Your Current Metrics Can't Answer
"Of the patients who discontinued in Q4, how many experienced coverage disruption in the 90 days prior?"
Your systems know:
Your systems don't know:
That gap is the 90%.
And it's where the One Big Beautiful Bill Act's coverage volatility will cause the most damage to persistence—invisibly, buried in your existing "non-adherence" metrics.
The Competitive Advantage
The pharma companies building these metrics now will own the narrative in 2027 payer negotiations:
"Our persistence rates held steady through 2026-2027 coverage disruption because we could detect and intervene on coverage gaps proactively. We maintained therapeutic continuity where competitors saw unexplained discontinuation."
Those tracking only operational metrics will report declining outcomes with no explanation—and weaker negotiating positions.
What To Do Before Your Next Quarterly Review
Ask your patient support team three questions:
1. Can we identify coverage disruption before it causes discontinuation?
If the first signal is "patient hasn't filled in 60 days"—you're detecting coverage gaps weeks too late.
2. Do we track why patients discontinue, or just that they did?
If your dashboard shows "discontinued" without root cause categorization—you can't explain the 15% YoY decline to your board.
3. Can we measure the 90%?
If all your metrics are vendor performance and none track coverage continuity—you're optimizing for the 10% while persistence erodes in the 90%.
Linked Patient Learning helps biopharma companies redesign patient support metrics to detect coverage disruption in the 90%—before it becomes discontinuation in your reports.
Schedule a 30-minute Metrics Assessment:
We'll audit your current patient support dashboard, show you which coverage churn signals you're missing, and map the 3 core metrics to your existing data sources.
Written by
Linked Patient Learning
Share your details and we'll send you the playbook.